
Figure 4.17: Geometry of the solution domain for the constricted tube flow
The method is applied to an even more challenging turbulent flow case: turbulent flow through a tube with a sinusoidal constriction, as shown in Figure 4.17.

Figure 4.17: Geometry of the solution domain for the constricted tube flow
This flow has been studied experimentally by Deshpande and Giddens (1980). Earlier numerical studies related to this flow type have been carried out by Rastogi (1984) and Melaaen (1991). The former used general orthogonal coordinates with a staggered grid arrangement, while the latter employed general non-orthogonal coordinates on a colocated grid.
Although the flow is axisymmetric, it was found that there is not much difference between the flow through a planar constricted duct and through a circular constricted pipe. Therefore, we consider the calculation of the flow in 2D plane constriction.
The height of the duct is 50.8 mm and the Reynolds number based on that height and
the average inlet velocity is 15,000. The height and the base length of the
constriction are  and
and  , respectively, where
  is the half
height of the duct. Due to symmetry, only the lower half of the domain needs to be
considered. The inlet profiles for the velocity and turbulence quantities were
specified at the plane
  . Following Deshpande et al. (1980), at the
inlet a fully-developed power-law profile (
 ) is assumed for the
streamwise velocity:

where  is the centerline velocity.
For the turbulence quantities k and
  , the following inlet profiles are
assumed:
Here,  is the turbulence intensity, taken to be 3% and l
is the mixing length given by:

In addition, wall functions, symmetry and outstream conditions are imposed in the usual way.
Grid dependence tests have been performed with four grids, consisting of 50x20, 75x30, 100x60 and 150x100 cells, respectively. Figure 4.18 shows the 50x20 grid. The test focussed primarily on the separation and reattachment lengths. The computed separation and reattachment lengths are presented, together with the measurements

Figure 4.18: A typical grid for the constricted tube flow (50x20 cells)
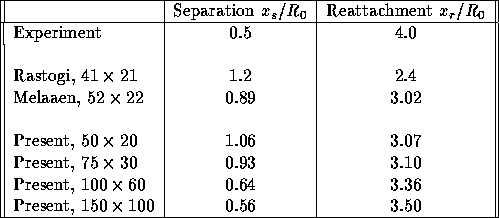
Table 4.1: Variation of separation and reattachment lengths with different grids
and earlier calculations of Rastogi and Melaaen in Table 4.1.
From this Table it is seen that calculated separation length is overpredicted,
while the reattachment length is underpredicted. Furthermore, the agreement
between the present results and the results of Melaaen corresponding to grid
resolution of the same order can be said to be satisfactory. It should be
noted that Rastogi used the hybrid scheme and Melaaen used the power law scheme of
Patankar (1980) for solving both the momentum and turbulence equations. Moreover,
Melaaen also employed a second-order upwind scheme [Peric, 1985] for solving the
momentum equations while the power law scheme is still used for solving turbulence
equations. In that case, on the 52x22 grid the calculated separation and
reattachment lengths are  and
and  , respectively, as
has been reported in [Melaaen, 1991].
The predicted lengths of separation and reattachment decrease and increase,
respectively, with grid refinement approaching the experimental lengths.
Although the reattachment and separation lengths still show some variation between
two finest grids, further mesh refinement was not perform because of prohibitive
demands for computing time and to avoid that the first  point is too close
to the wall. Hence, all subsequent computations were done with a 150x100 grid.
Figure 4.19 presents typical features of this flow, including streamlines and contours of isobars and turbulence quantities.
Figures 4.20, 4.21 and 4.22 show the streamwise velocity
predictions at different stations. The calculation is seen to yield good agreement
with the measurements, except for the station  , although the profiles
shapes are the same. This
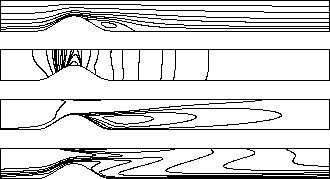
Figure 4.19: Typical flow pattern for contricted tube: streamlines, isobars,
turbulence intensity and length scales, respectively
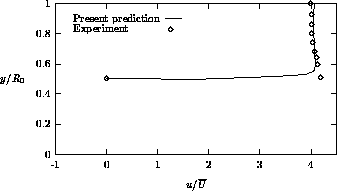
Figure 4.20: Streamwise velocity profile at 
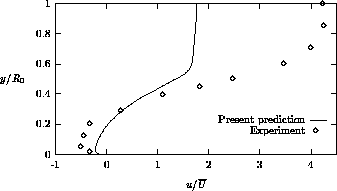
Figure 4.21: Streamwise velocity profile at 
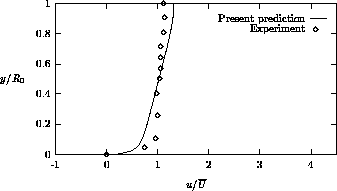
Figure 4.22: Streamwise velocity profile at 
is not surprising, because it is well-known that the k- model does not
scale well in and around the recirculation zone. Furthermore, both the present
method and the methods of Rastogi and Melaaen produce very similar velocity
profiles.
Figure 4.23 shows a comparison of the predicted wall static pressure
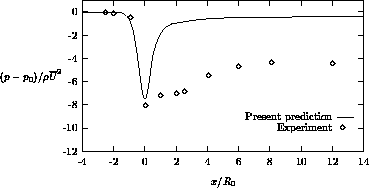
Figure 4.23: Wall static pressure distribution
with the measurements. In the acceleration region, where a steep decline of the pressure occurs, the pressure is well predicted. In the deceleration part, however, the present method gives an excessive pressure recovery. The same conclusion is drawn by both Rastogi and Melaaen.
Finally, the profile of the centerline turbulence intensity is compared with measurements in Figure 4.24.
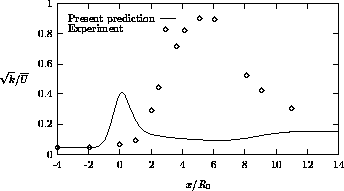
Figure 4.24: Turbulence intensity distribution along the centerline
The comparison indicates that the predicted turbulence intensity increases too
early, and the measured one increases after separation occurs, whereas the
computed one decreases there. Moreover, the peak of the predicted turbulence
intensity is too low. Again, it is believed that the errors lie in the k- model. Although the agreement between the predicted and measured turbulence
intensity is not satisfactory, there is a qualitative accordance with the
computed results of Rastogi.